- MNIST のロードでは,つぎのものがロードされる:
(x_train, y_train) : 訓練用データセット
──モデルの訓練に使用
(x_test, y_test) : テスト用データセット
──訓練されたモデルのテストに使用
- labels は 0から9までの整数の配列で,各数がそれの数字の class に対応している:
| Label | Class |
| 0 | 0 |
| 1 | 1 |
| 2 | 2 |
| 3 | 3 |
| 4 | 4 |
| 5 | 5 |
| 6 | 6 |
| 7 | 7 |
| 8 | 8 |
| 9 | 9 |
- (x_train, y_train) は、
28×28ピクセルの画像が60,000枚──ラベル (0〜9) が60,000個
>>> x_train.shape
(60000, 28, 28)
>>> len(y_train)
60000
>>> y_train
array([5, 0, 4, ..., 5, 6, 8], dtype=uint8)
- (x_test, y_test) は,
28×28ピクセルの画像が10,000枚──ラベル (0〜9) が10,000個:
>>> x_test.shape
(10000, 28, 28)
>>> len(y_test)
10000
>>> y_test
array([7, 2, 1, ..., 4, 5, 6], dtype=uint8)
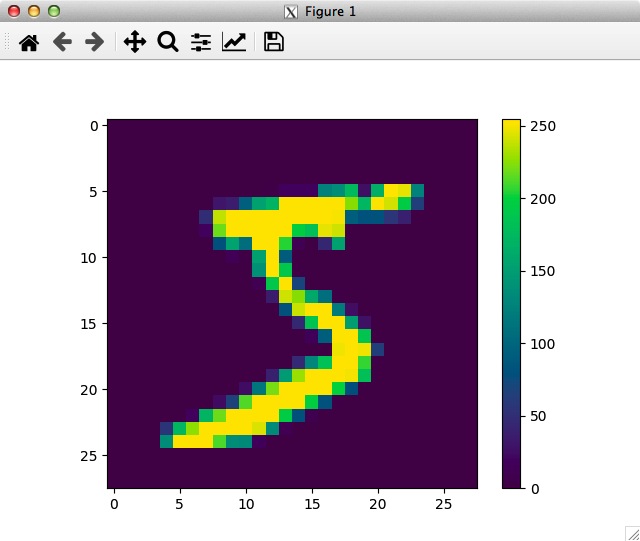
- images (28×28 ピクセル) は,ピクセルの値が 0から255の間の整数。
画像 x_train[0]) の場合:
>>> print("x_train[0]=%s" % x_train[0])
x_train[0]=[[ 0 0 0 0 0 0 0 0 0 0 0 0 0 0 0 0 0 0 0 0 0 0 0 0 0 0 0 0]
[ 0 0 0 0 0 0 0 0 0 0 0 0 0 0 0 0 0 0 0 0 0 0 0 0 0 0 0 0]
[ 0 0 0 0 0 0 0 0 0 0 0 0 0 0 0 0 0 0 0 0 0 0 0 0 0 0 0 0]
[ 0 0 0 0 0 0 0 0 0 0 0 0 0 0 0 0 0 0 0 0 0 0 0 0 0 0 0 0]
[ 0 0 0 0 0 0 0 0 0 0 0 0 0 0 0 0 0 0 0 0 0 0 0 0 0 0 0 0]
[ 0 0 0 0 0 0 0 0 0 0 0 0 3 18 18 18 126 136 175 26 166 255 247 127 0 0 0 0]
[ 0 0 0 0 0 0 0 0 30 36 94 154 170 253 253 253 253 253 225 172 253 242 195 64 0 0 0 0]
[ 0 0 0 0 0 0 0 49 238 253 253 253 253 253 253 253 253 251 93 82 82 56 39 0 0 0 0 0]
[ 0 0 0 0 0 0 0 18 219 253 253 253 253 253 198 182 247 241 0 0 0 0 0 0 0 0 0 0]
[ 0 0 0 0 0 0 0 0 80 156 107 253 253 205 11 0 43 154 0 0 0 0 0 0 0 0 0 0]
[ 0 0 0 0 0 0 0 0 0 14 1 154 253 90 0 0 0 0 0 0 0 0 0 0 0 0 0 0]
[ 0 0 0 0 0 0 0 0 0 0 0 139 253 190 2 0 0 0 0 0 0 0 0 0 0 0 0 0]
[ 0 0 0 0 0 0 0 0 0 0 0 11 190 253 70 0 0 0 0 0 0 0 0 0 0 0 0 0]
[ 0 0 0 0 0 0 0 0 0 0 0 0 35 241 225 160 108 1 0 0 0 0 0 0 0 0 0 0]
[ 0 0 0 0 0 0 0 0 0 0 0 0 0 81 240 253 253 119 25 0 0 0 0 0 0 0 0 0]
[ 0 0 0 0 0 0 0 0 0 0 0 0 0 0 45 186 253 253 150 27 0 0 0 0 0 0 0 0]
[ 0 0 0 0 0 0 0 0 0 0 0 0 0 0 0 16 93 252 253 187 0 0 0 0 0 0 0 0]
[ 0 0 0 0 0 0 0 0 0 0 0 0 0 0 0 0 0 249 253 249 64 0 0 0 0 0 0 0]
[ 0 0 0 0 0 0 0 0 0 0 0 0 0 0 46 130 183 253 253 207 2 0 0 0 0 0 0 0]
[ 0 0 0 0 0 0 0 0 0 0 0 0 39 148 229 253 253 253 250 182 0 0 0 0 0 0 0 0]
[ 0 0 0 0 0 0 0 0 0 0 24 114 221 253 253 253 253 201 78 0 0 0 0 0 0 0 0 0]
[ 0 0 0 0 0 0 0 0 23 66 213 253 253 253 253 198 81 2 0 0 0 0 0 0 0 0 0 0]
[ 0 0 0 0 0 0 18 171 219 253 253 253 253 195 80 9 0 0 0 0 0 0 0 0 0 0 0 0]
[ 0 0 0 0 55 172 226 253 253 253 253 244 133 11 0 0 0 0 0 0 0 0 0 0 0 0 0 0]
[ 0 0 0 0 136 253 253 253 212 135 132 16 0 0 0 0 0 0 0 0 0 0 0 0 0 0 0 0]
[ 0 0 0 0 0 0 0 0 0 0 0 0 0 0 0 0 0 0 0 0 0 0 0 0 0 0 0 0]
[ 0 0 0 0 0 0 0 0 0 0 0 0 0 0 0 0 0 0 0 0 0 0 0 0 0 0 0 0]
[ 0 0 0 0 0 0 0 0 0 0 0 0 0 0 0 0 0 0 0 0 0 0 0 0 0 0 0 0]]
>>>
この画像を表示する:
>>> import matplotlib.pyplot as plt
>>> plt.figure()
<Figure size 640x480 with 0 Axes>
>>> plt.imshow(x_train[0])
<matplotlib.image.AxesImage object at 0x602b5e90>
>>> plt.colorbar()
<matplotlib.colorbar.Colorbar object at 0x58888a70>
>>> plt.grid(False)
>>> plt.show()
window を閉じると,python のプロンプトに戻る
PC のターミナルで作業している場合
つぎの条件の下で,PC のデスクトップにこの window が現れる:
- ssh を -X オプションで接続している
- Raspberry Pi からの X11forwarding が成っている
 X Window System X Window System
X11接続ができていないときは,つぎのようになるので,それとわかる:
>>> plt.show()
__main__:1: UserWarning: Matplotlib is currently using agg, which is a non-GUI backend,
so cannot show the figure.
>>>
このときは,ターミナルで新しくシェルを開き,-X オプションで ssh接続し,これまでの作業を最初から行う:
$ source ./venv/bin/activate
(venv) $ python
>>> from tensorflow import keras
>>> mnist = keras.datasets.mnist
>>> (x_train, y_train), (x_test, y_test) = mnist.load_data()
>>> import matplotlib.pyplot as plt
>>> plt.figure()
<Figure size 640x480 with 0 Axes>
>>> plt.imshow(x_train[0])
<matplotlib.image.AxesImage object at 0x602b5e90>
>>> plt.colorbar()
<matplotlib.colorbar.Colorbar object at 0x58888a70>
>>> plt.grid(False)
>>> plt.show()
|